

The leaves are changing and the beauty of fall is all around us. As a Toronto real estate agent, this is the perfect time of year for showings. Not too hot and not too cold. As we move into Fall, we have seen many news reports that focus on the residential real estate market and the trends we can expect to see. Let’s take a look at the September Toronto Real Estate Market Watch results in the GTA and surrounding areas.
Toronto Market Update
The Toronto Regional Real Estate Board reported that the average price of a home (including all types) was up 3% year-over-year despite inventory and borrowing costs. The average price in September was $1,119,428 compared to $1,086,762 last year according to the Toronto Real Estate Market Watch report.
Though the average price was slightly up year-over-year, the number of transactions (sales) reported by TRREB was down 7.1% but active listings were up by nearly 40%. To look at that in values, there were 18,912 homes for sale last month and 13,529 last year at the same time. The drop in year-over-year sales was particularly glaring in ground-oriented dwellings, notably with semi-detached houses and townhouses. Even when considering sales on a month-over-month basis after accounting for seasonal adjustments, a minor decrease was still evident.
Average Home Price in the GTA By Month 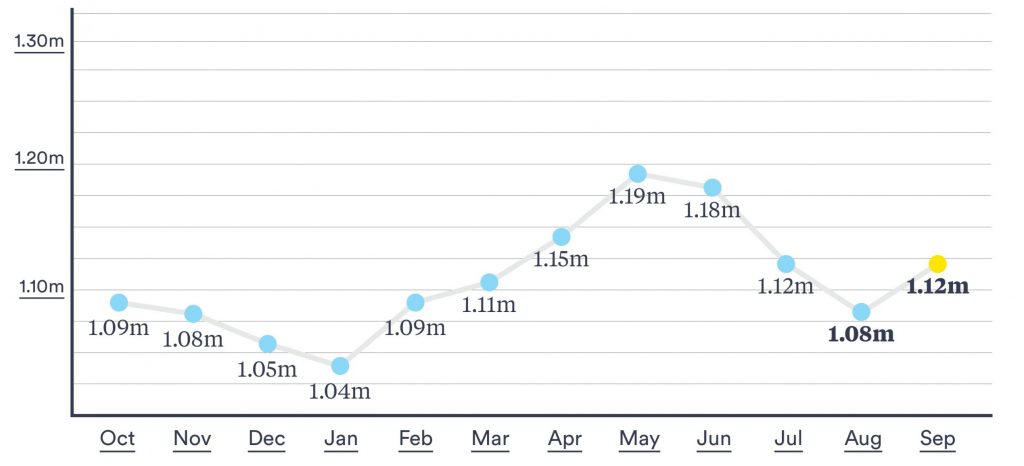

TRREB’s Chief Market Analyst
Jason Mercer, TRREB’s Chief Market Analyst has said that residential prices continue to slightly exceed the average price from the first quarter of this year. However, the market showed more balance during the summer and early fall. As we continue to see more and more listings pop up, Jason anticipates that prices will soften and ideally counterbalance borrowing costs.
Let’s take a look at some of the regional stats across the GTA, Toronto, Mississauga, Oakville, Durham Region, York Region and Brampton.
GTA Real Estate Market Stats
Toronto Real Estate Market Stats
Toronto’s average sale price (all home types) was down 4.9% in September 2023 to $1,100,770 (year-to-date) when compared to September 2022. However, when comparing the year-over-year average, prices were up 5.4% to $1,119,452. Condo prices were down 4.8% to $732,106 (year-over-year) while sales were down 2.9% (850 condo sales).
Mississauga Real Estate Market Stats
Mississauga’s average sale price (all home types) was down 6.7% in September 2023 to $1,065,009 (year-to-date) when compared to September 2022. However, when comparing the year-over-year average, prices were only slightly down by 1.1% with an average of $1,021,324. Condo prices in Mississauga were up 2.2% to $652,653 (year-over-year) while sales were down 1.6% (122 condo sales).
Oakville Real Estate Market Stats
Oakville’s average sale price (all home types) was down 6.8% in September 2023 to $1,546,424 (year-to-date) when compared to September 2022. However, when comparing the year-over-year average, prices were slightly up by 1.1% with an average price of $1,551,189. Condo prices in Oakville were slightly up 2.5% to $750,910 (year-over-year) while sales were down by 15.6%.
Durham Region Real Estate Market Stats
Durham Region’s average sale price (all home types) was down 9.9% in September 2023 to $945,995 (year-to-date) when compared to September 2022. However, when comparing the year-over-year average, prices were fairly consistent with an average price of $907,359. Condo prices in the Durham Region were down 6.2% to $556,876 (year-over-year) while sales were up 42.1%.
York Region Real Estate Market Stats
York Region’s average sale price (all home types) was down 4.4% in September 2023 to $1,351,747 (year-to-date) when compared to September 2022. However, when comparing the year-over-year average, prices were up by 6.8% with an average of $1,330,636. Condo prices in the York Region were up 3.1% to $717,103 (year-over-year) while sales were down by 2.4%.
Brampton Real Estate Market Stats
Brampton’s average sale price (all home types) was down 11.6% in September 2023 to $1,061,351 (year-to-date) when compared to September 2022. However, when comparing the year-over-year average, prices were up 3.4% with an average of $1,041,829. Condo prices in Brampton were down 4.5% to $541,659 (year-over-year) while sales were up 12.5%.
If you or someone you know is looking to buy, sell, or invest, our team of Toronto real estate experts is here to help. Feel free to book a no-obligation chat. Book Consultation.
Danielle Demerino
ddemerino@royallepage.ca
416-728-5401
Brittany Huggins
bhuggins@royallepage.ca