The clocks have fallen back, the days have gotten shorter and the residential real estate market continues to adjust. This month, we have seen prices hit somewhat of a consistent stride when compared to last month. My name is Danielle Demerino and I’m a Toronto real estate agent and here to report on how the market performed in October, 2022. As usual, you don’t want to miss this, so let’s get to it. Before I dive in, let me remind you the stats you are seeing year-to-date or year-over-year. For those who are not familiar, YOY looks at a 12-month change and YTD looks at a change relative to the beginning of the year, usually January 1st.
The average price of a house in the Greater Toronto Area (based on all home types) in October 2022 was $1,089,428 compared to $1,086,762 in September 2022 (year-over-year). The number of properties for sale however saw the biggest change, up 68% compared to this time last year. By October 31st, 2022, there were 13,000 plus homes available for sale compared to 7,750 at the end of October in 2021.
We also watched the number of transactions take a nose dive, which is expected as interest rates continue to rise. The number of monthly sales were down 49% from last October. There were 9,783 transactions in October 2021 compared to 4,961 this year. With the continuation of increasing interest rates and the growing inventory pool, it is inevitable that less transactions are going to happen, people have time and less pressure to find a home.
The average home (all types) in the GTA in October 2022 was down 5.7% to $1,089,428 from $1,155,345 in October 2021. Of course, no one likes to see the value of their home depreciate; however, the good news is that homes in the GTA are still selling. Considering the huge appreciation jump we saw during the last couple of years, a 6% drop really isn’t too bad for home owners who have had skin in the game for the long haul and for those of you who purchased during the peak, just hang in there and be patient, real estate is the long game.
With a city the size of ours and the population continuing to grow, so will the demand for homes. The available inventory in the GTA is currently around 2.63 months. Which means, if there were no more properties available for sale, the GTA would sell out of residential properties in just under three months. There needs to be more inventory to really see a shift in pricing and it’s simply not available. With that said, if you are looking to sell your home right now and need some help putting together a plan, we would be happy to help guide you.
Condo sales on the other hand continue to remain constant and have actually appreciated 2% in the GTA when comparing to October 2021. Condominiums continue to be a great, affordable option to get your foot in the door to home ownership in Toronto! If you are looking to purchase a condo, check out our blog on tips to buying a condo in Toronto.
Let’s now take a look at some of our regional markets, mainly the GTA, Toronto, York, Durham Region, Mississauga, Oakville, and Brampton.
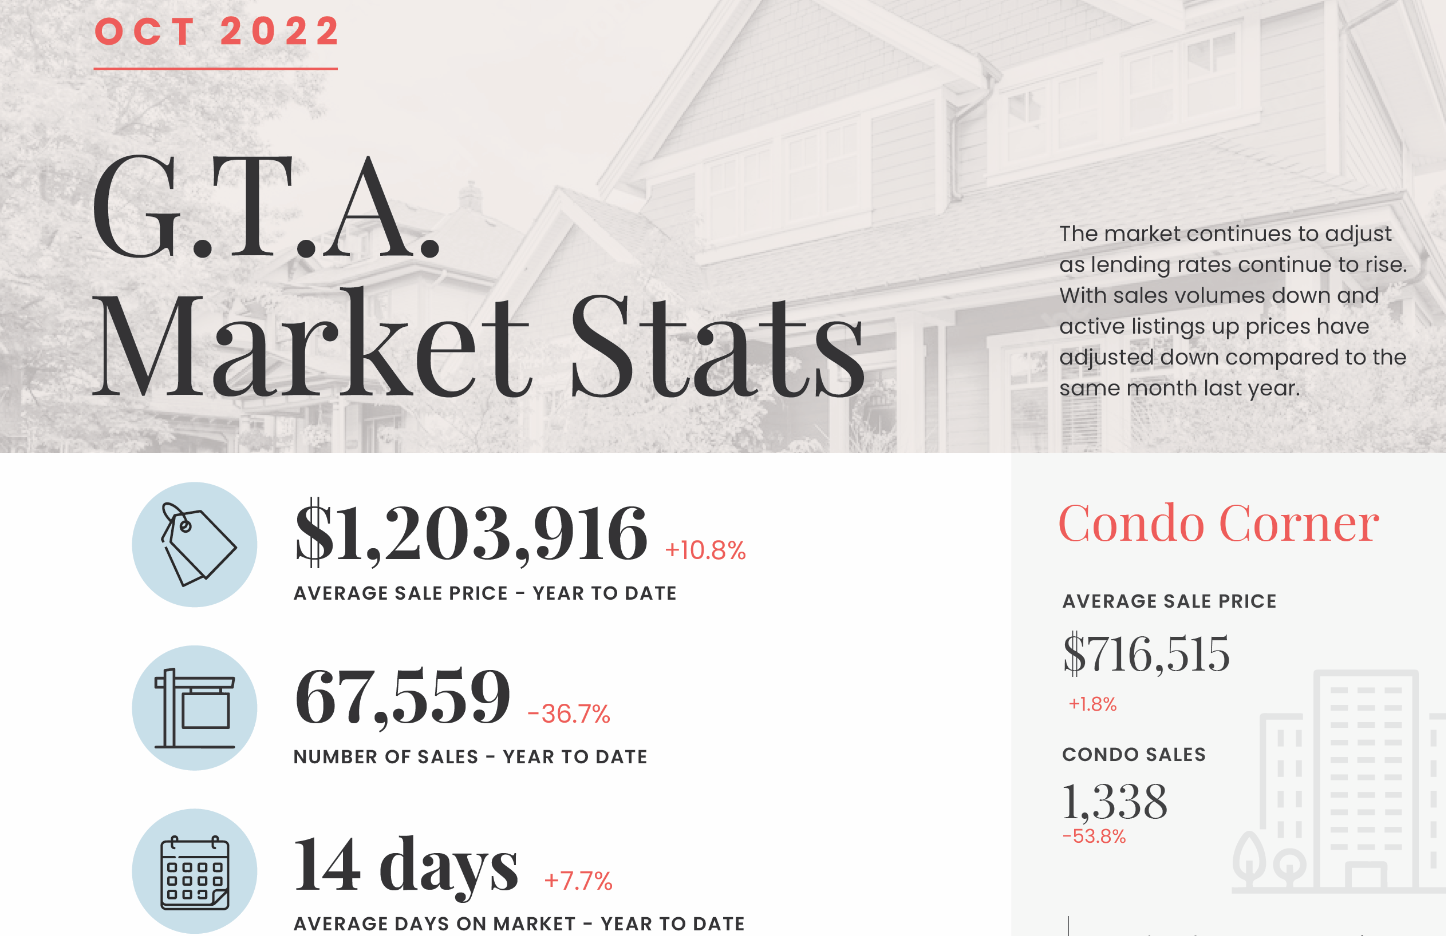
GTA Real Estate Market Stats
The GTA’s average sale price (all home types) was up by 10.8% in October 2022 to $1,203,916 (year-to-date) when compared to October 2021. Condo prices were up 1.8% to $716,515 (year-to-date) when compared to this time last year.
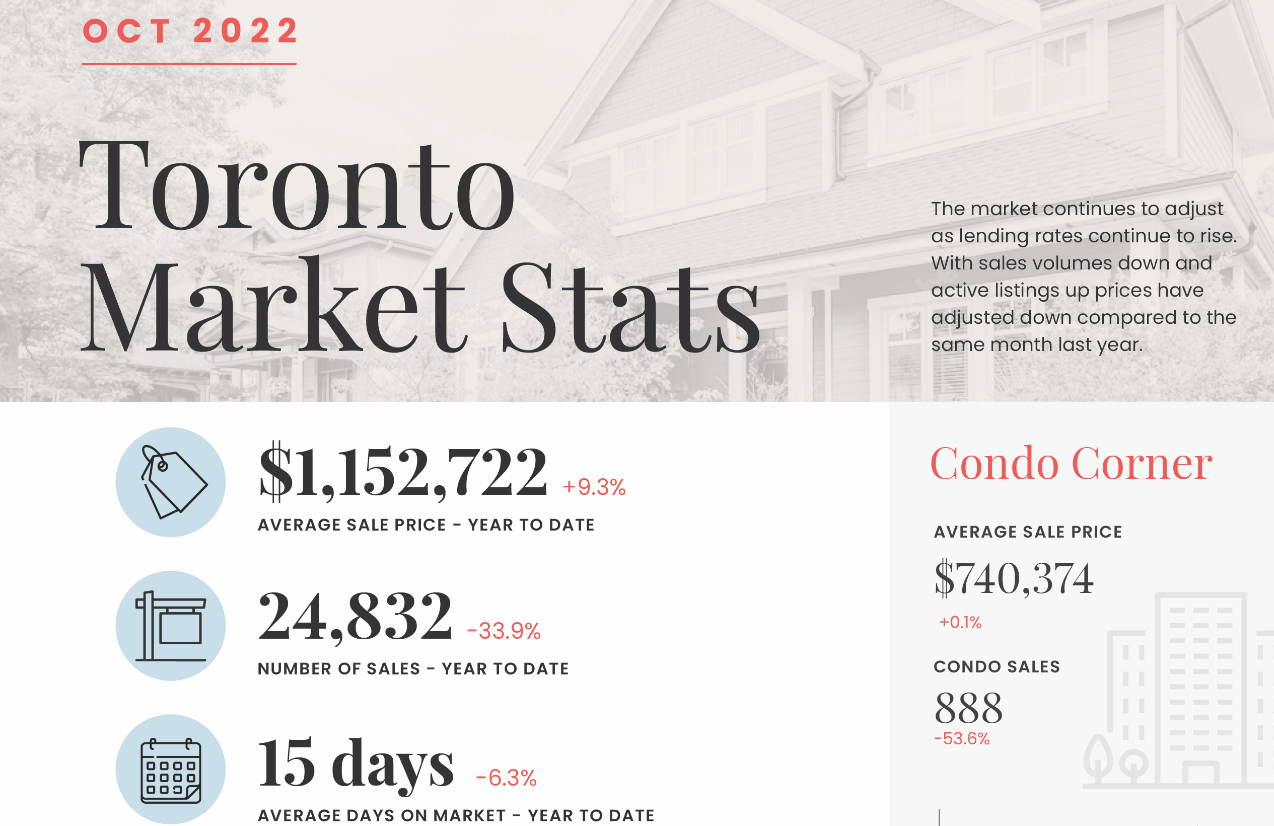
Toronto Real Estate Market Stats
Toronto’s average sale price (all home types) was up by 9.3% in October 2022 to $1,152,722 (year-to-date) when compared to October 2021. Condo prices were up 0.1% to $740,374 (year-to-date) when compared to this time last year.
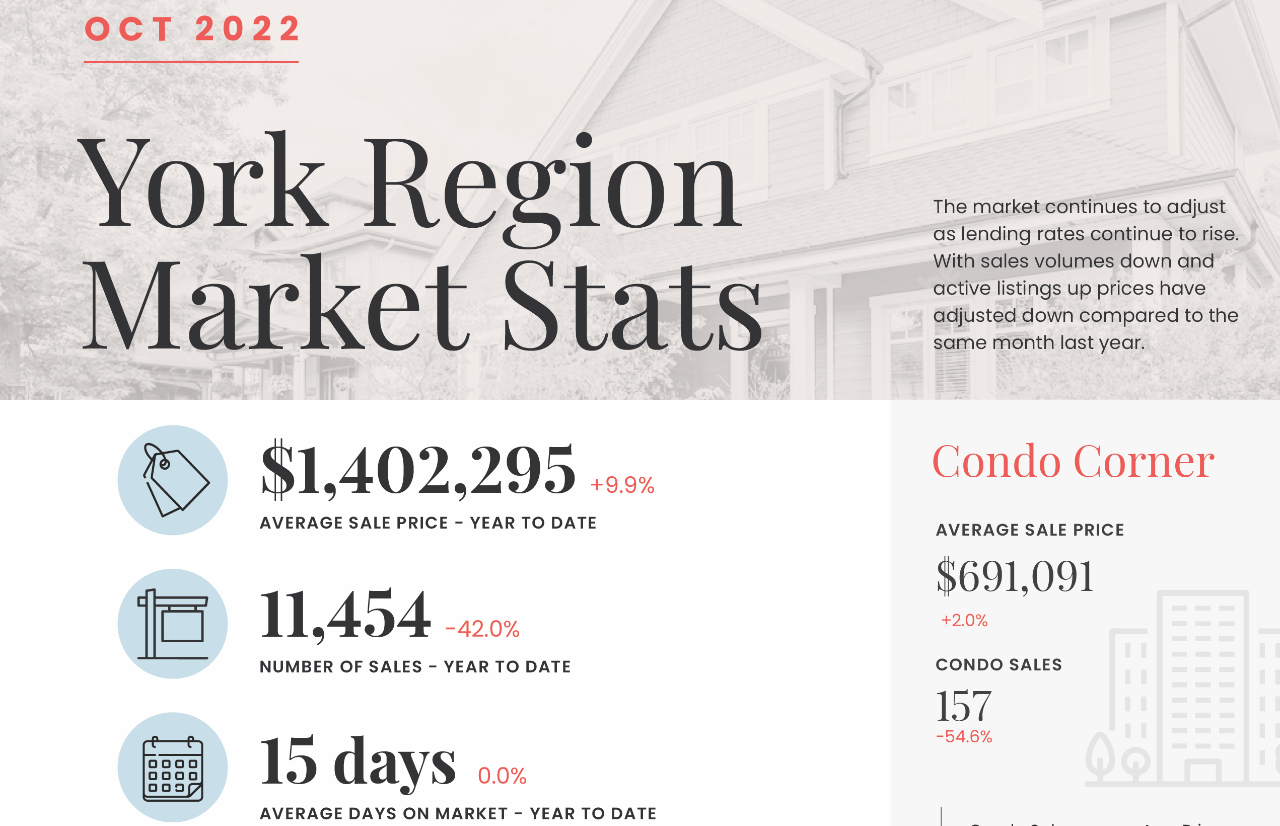
York Region Real Estate Market Stats
York Region’s average sale price (all home types) was up by 9.9% in October 2022 to $1,402,295 (year-to-date) when compared to October 2021. Condo prices were up 2% to $691,091 (year-to-date) when compared to this time last year.
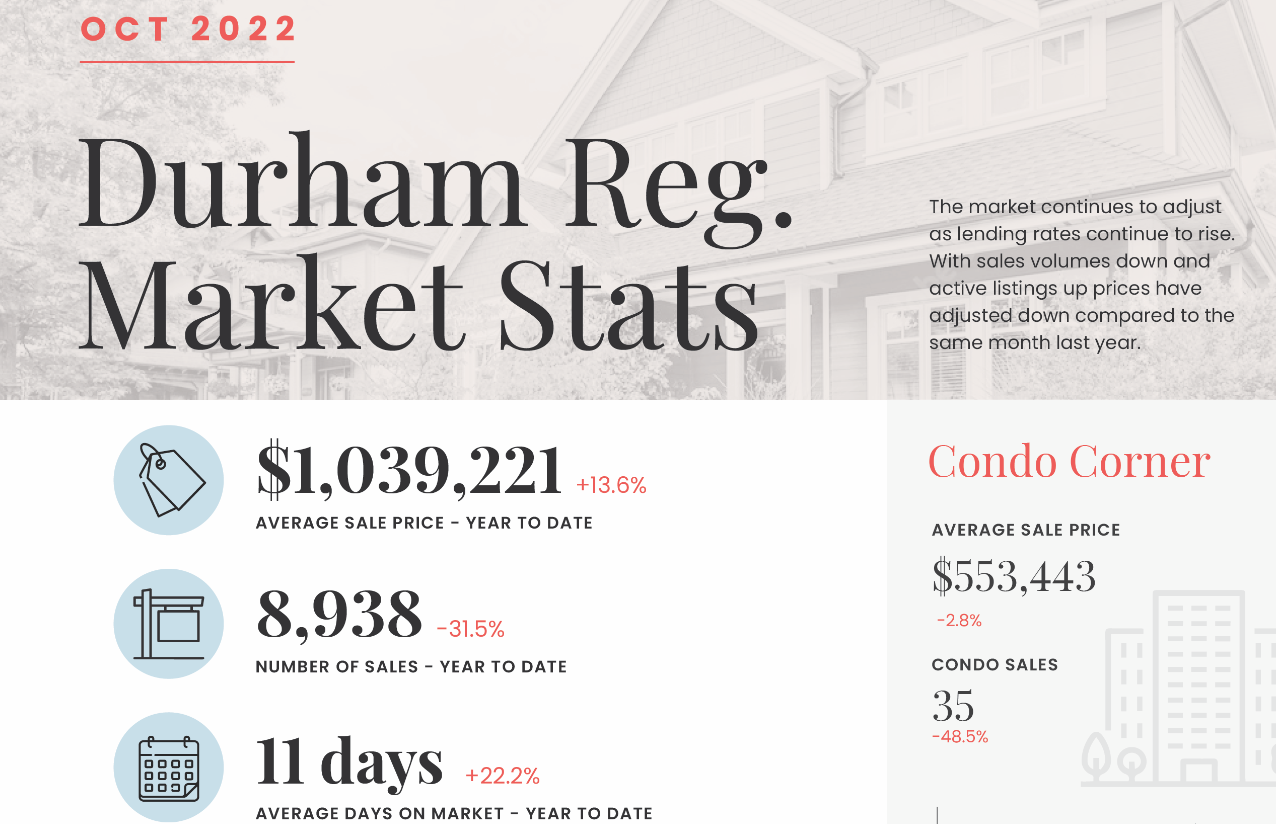
Durham Region Real Estate Market Stats
Durham Region’s average sale price (all home types) was up by 13.6% in October 2022 to $1,039,221 (year-to-date) when compared to October 2021. Condo prices were down 2.8% to $553,443 (year-to-date) when compared to this time last year.
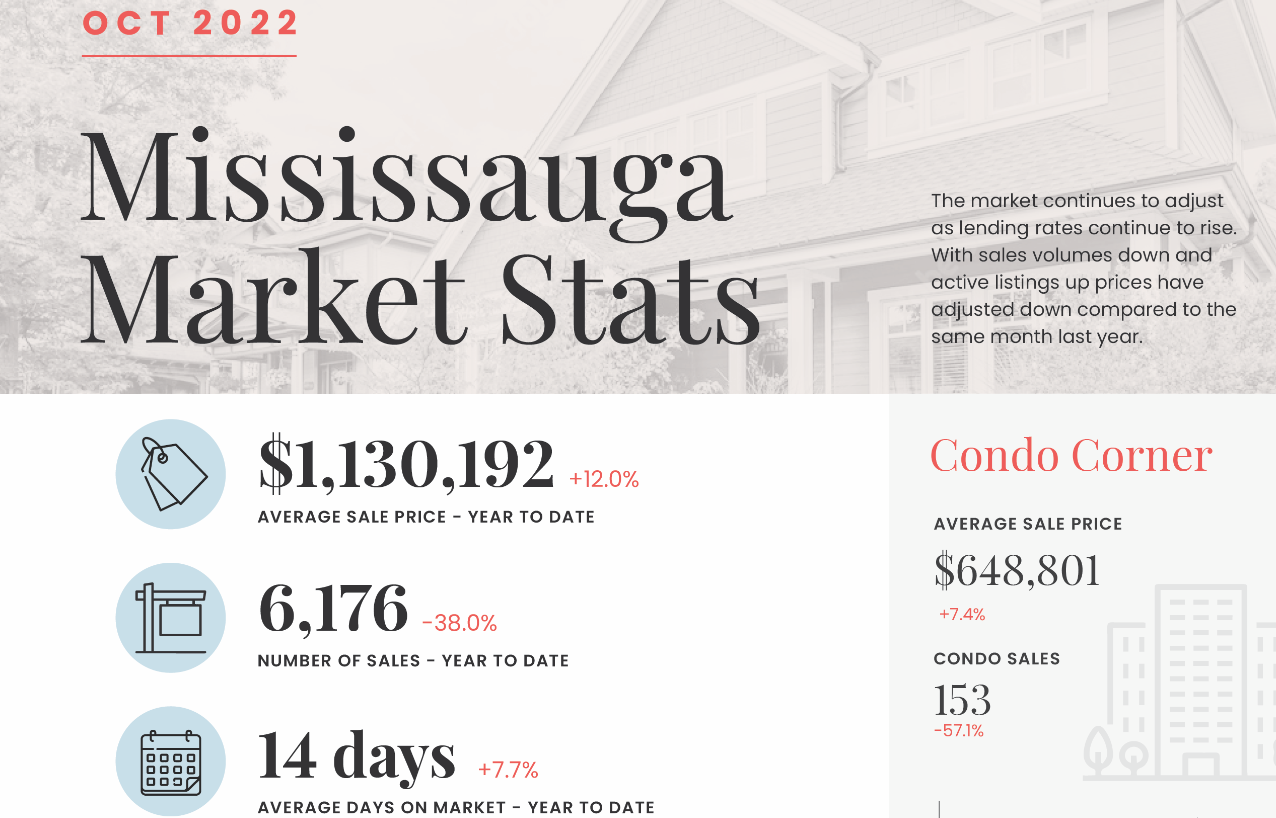
Mississauga Real Estate Market Stats
Mississauga’s average sale price (all home types) was up by 12% in October 2022 to $1,130,192 (year-to-date) when compared to October 2021. Condo prices were up 7.4% to $648,801 (year-to-date) when compared to this time last year.
Oakville Real Estate Market Stats
Oakville’s average sale price (all home types) was up by 12% in October 2022 to $1,645,715 (year-to-date) when compared to October 2021. Condo prices were up 6% to $824,237 (year-to-date) when compared to this time last year.

Brampton Real Estate Market Stats
Brampton’s average sale price (all home types) was up by 16% in October 2022 to $1,187,358 (year-to-date) when compared to October 2021. Condo prices were up 2.4% to $542,825 (year-to-date) when compared to this time last year.

So there you have it, take in the numbers and let us know what you think! If you would like further statistics on a different region or neighbourhood, please do not hesitate to reach out via phone, email or website form! Contact details below.
Danielle Demerino
ddemerino@royallepage.ca
416-728-5401
Brittany Huggins
bhuggins@royallepage.ca
647-863-7234
MORE INFO:
Buy With Us
Sell With Us
Free Home Evaluation