As we near the end of another summer, we anticipate that we are also nearing the end of the slow season in real estate! Though we have still seen year-over-year increases in prices and sales, we can expect to see things pick up come September and October. With that said, let’s take a look at last months market trends to understand where the market was in August 2018 compared to previous years!
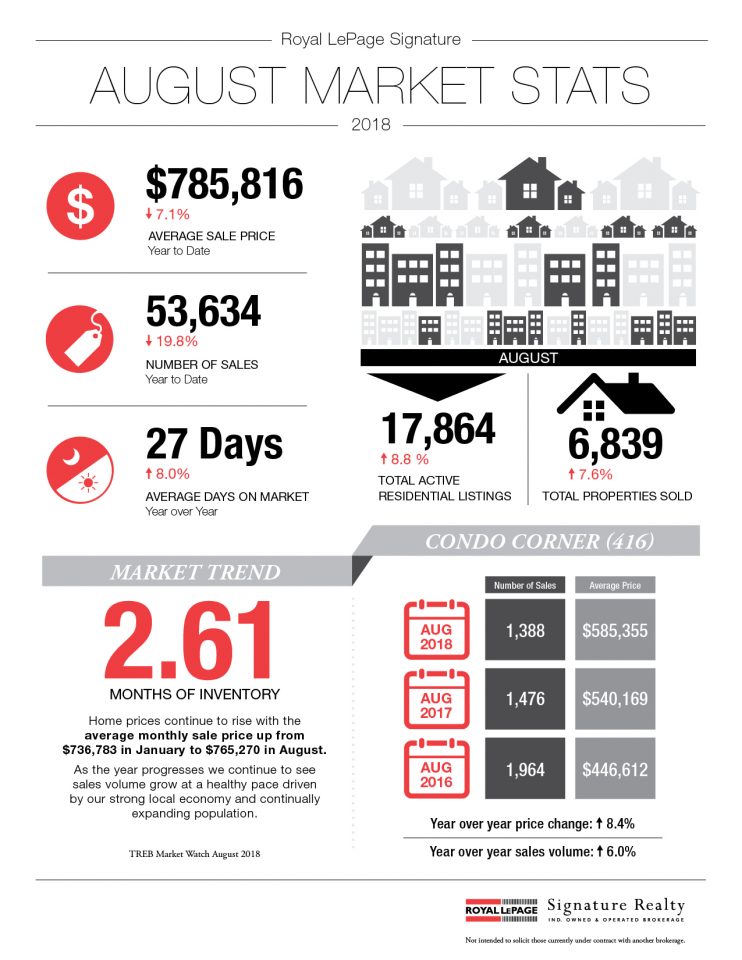
Sales in the GTA appeared to be up 8.5% in August 2018 compared to August 2017 and a total of 6,839 sales through TREB’s MLS were reported. The average selling price and Home Price Index (home prices for a specific house type in a given neighbourhood) were also up when comparing August 2018 to 2017, 4.7 and 1.5% respectively. With the average selling price sitting at $765,270, we saw a larger increase in the price of detached homes compared to other home types.
While the market is certainly not what it was in past years, it is encouraging to see a recovery in the demand for home ownership! With the new mortgage guidelines and the Ontario Fair Housing Plan in action, buyers seemed to take a seat last year, however appear to be ready to hunt again!
While sales were up in August 2018 by a mere 2% compared to July, 2018, the average price of sales was down ever so slightly by 0.2%, compared to July (following strong increases in May, June and July). In August, we watched the annual rate of sales growth outpace the annual rate of new listings, which in a nutshell tells us some GTA neighbourhoods are suffering from a lack of inventory. This could present an issue if the demand continues to rise over the next year, according to Jason Mercer, TREB’s Director of Market Analysis.
To learn more about last months Market Trends, click on the graphics below!